The Big Picture
“But I’m just doing a local flight, ” you say. Bear with me. The big picture is important. With luck I'll show you why.

Mixed Surface Analysis
Here is the big picture. This is how I start my day, whether I'm flying or not. The value of this page, the Mixed Surface Analysis, is that there are three sets of information overlaid on the map, so you get a lot of information in one look. First there is a simplified surface analysis, showing the highs and lows and fronts. Then there is the IR Satellite info showing cloud cover. Finally there is radar info showing precipitation.
What I notice first is that pesky low out in the Atlantic, south of Nova Scotia. It was sitting in almost the same place yesterday. That's an orange flag – there is something blocking the normal west to east movement.
Let's say today's flight will be a short one: Lachute, Quebec (CSE4) to Ottawa, Ontario (CYOW). I imagine the tiny line on the Mixed Surface Analysis. For the starting point imagine a dot at the intersection of a line extending north from the New York/Vermont border where it crosses another line joining the US/Canada border east of Lake Ontario to the Gulf of St. Lawrence. The destination is near that southward kink in the Ontario/Quebec border. Not very far, on this scale. I see some precip over the Montreal area, and more in a line over Lake Ontario. I glance at the time on the chart: 0900Z. That's 4 AM.
Now let's look at the second big-picture page, the Jetstream.
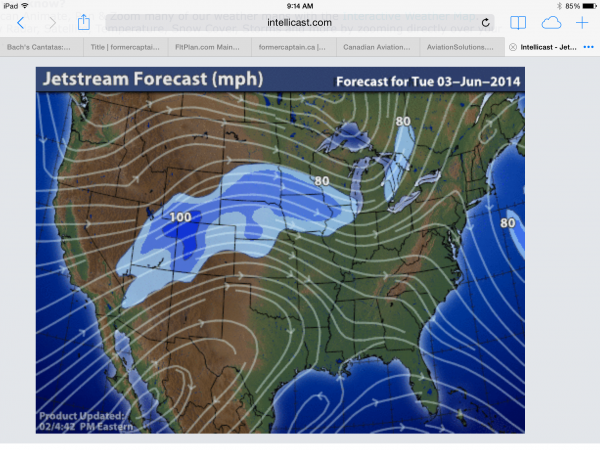
Jetstream
Why look at the upper winds, when we will be at 6000 feet? Again, stay with me and we'll see.
This is a fairly benign, normal summer chart, with one pertinent exception: the reverse flow caused by that low south of Nova Scotia. Notice how the flow over New England changes from southwest to northeast (a 180° difference). That could mean turbulence or unsettled weather. We also notice that the general movement over our route of flight will be southwest to northeast. We store that in our subconscious so we will have a “gut feeling” later when we're in the air thinking of how the weather is moving.
And speaking of movement, let's look at the 12-hour forecast.
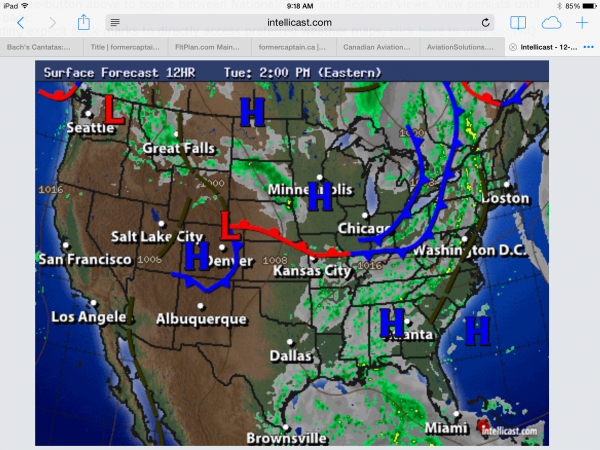
12 Hour Forecast
Oops – surprise! Not one cold front, but two in succession. As you can see on the chart, this is the picture for 2PM EDT, and that green and yellow line ahead (east) of the first cold front is probably one of the two areas we noticed on the Mixed Surface Analysis.
I am now eager for more detail, and head to Nav Canada's Aviation Weather Web Site (AWWS).
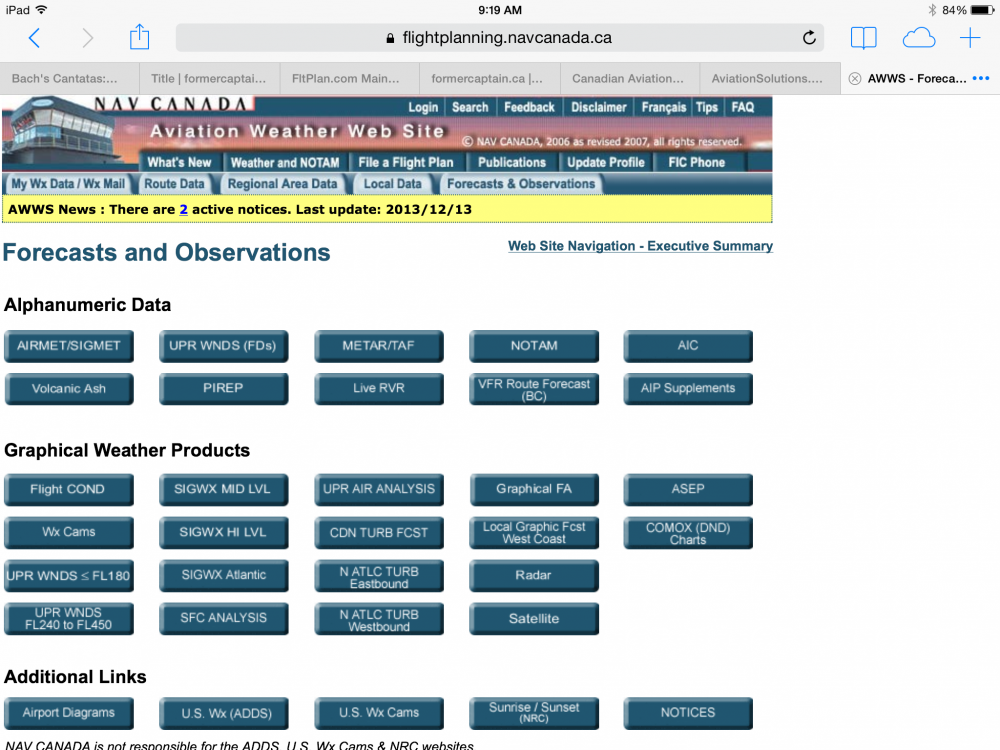
There is a wealth of information here. I will start with the Graphical Area Forecast (the Graphical FA button). Here is what I see next:
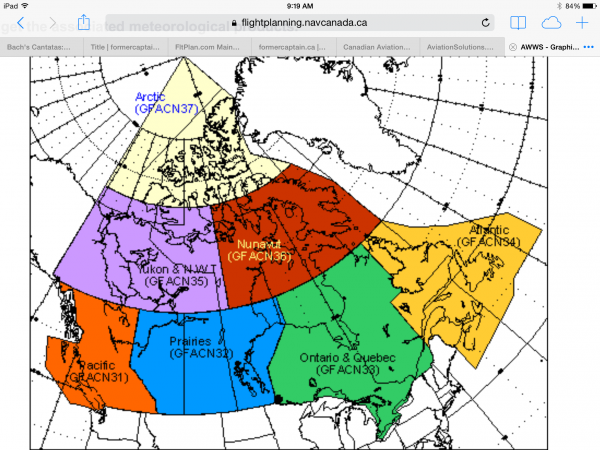
GFA Canada Map
I click on the green Quebec/Ontario area, and I get:
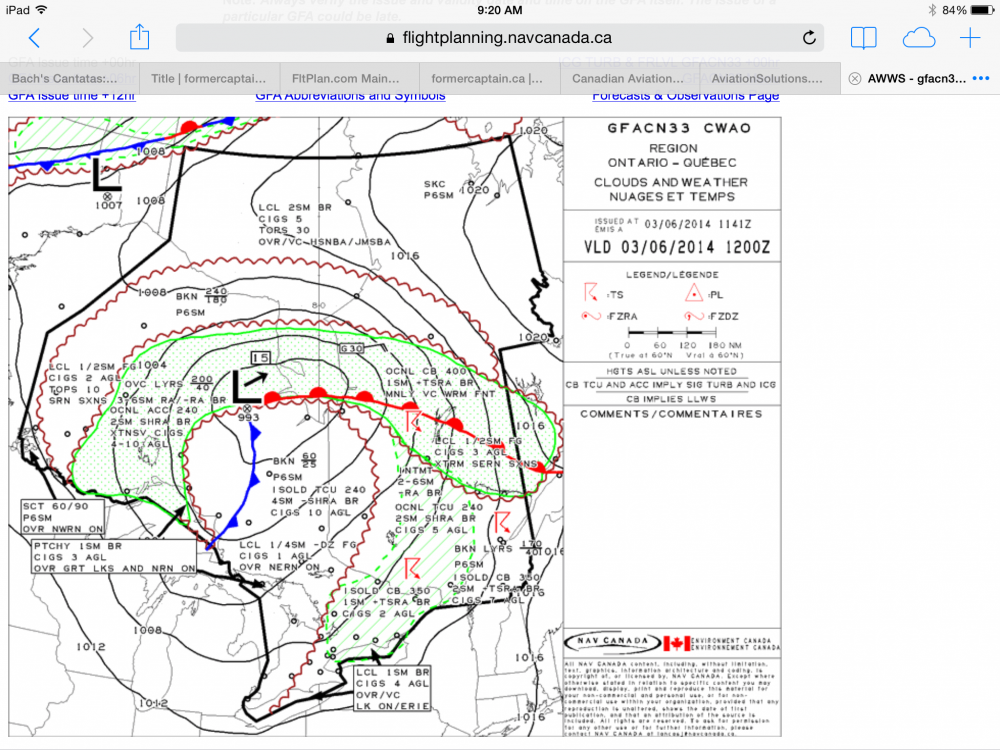
Clouds and Weather 1200Z
Our route is in the lower right of the picture. (Again, follow the New York/Vermont border north.) The first thing to notice is that red thunderstorm symbol near our track.
There is a low pressure area to our northwest. A warm front extends to the east from it, and a cold front dangles to the south. That will be the first of the two cold fronts we saw on the 12-hour Forecast above.
Glance at the time on the chart: 1200Z – that's 8AM local, and it's now after nine. Let's move ahead six hours. ( I missed it in this snapshot, but at the upper left you can just see the link to GFA + 12 Hours.) Here is the GFA + 6 hours:
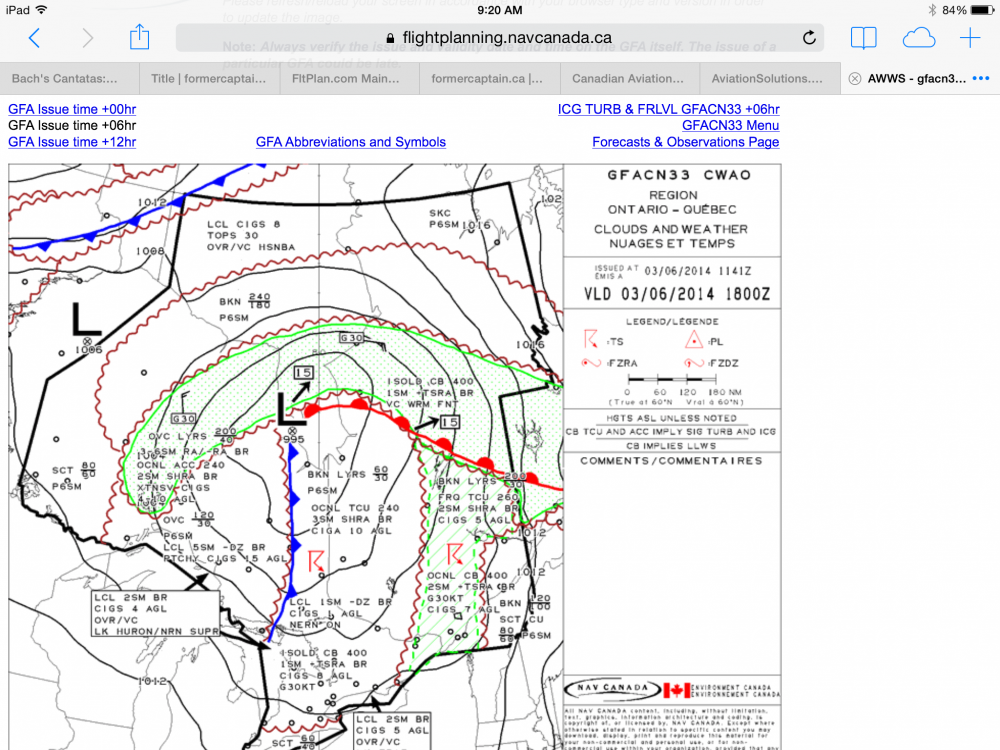
GFA 1800Z
This chart is for 1800Z – 2PM local. The thunderstorm symbol is still there. Observe the green-hatched area within the red scallops: our route is roughly between the three little donuts on the bottom-right and the two donuts on the bottom-left of the area. (These are St. Hubert, Dorval, and Mirabel; and Gatineau and Ottawa, respectively). Looking at the text, we translate: Occasional CumuloNimbus with tops to 40,000 feet, visibility 2 miles in Thunderstorms, rain and fog, surface winds gusting to 30 knots, and ceilings 700 feet above ground.
To complete the picture let's go to the companion page, the link on the upper right: ICG TURB & FRLVL + 6 hours:
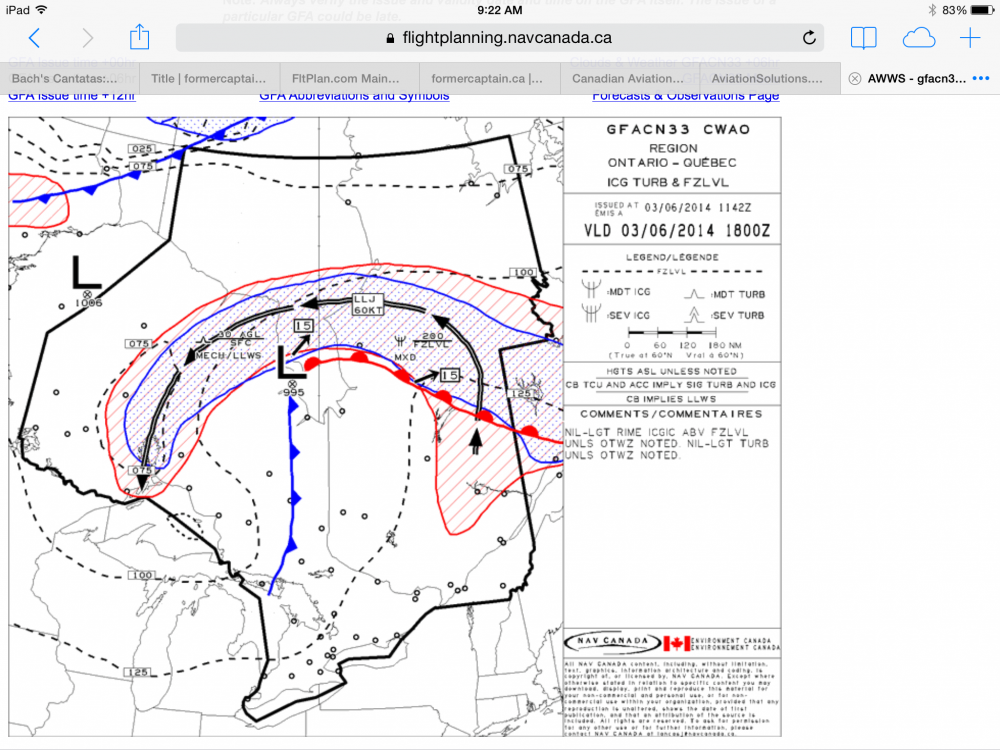
Icing, Turbulence, and Freezing Level 1800Z
Here we see the same low and fronts, the five donuts near our route, and some new stuff. There is a 60-knot low-level jet (LLJ) circling to the north of the low. The low is moving northeast at 15 knots. The freezing level (very important, because we have no de-icing equipment) is above 12,500 feet, well above our cruise altitude, so icing will not be a problem. There is no turbulence forecast for our route (that's the red-hatched area). But if we were heading for KUUJJUAC in a turboprop we could expect moderate icing below Flight Level 280 east of James Bay. And notwithstanding the lack of red hatching on our route, if we blunder into a thunderstorm we can expect turbulence severe enough to break up the airplane.
At this point I would get into the details, the NOTAMS, METARS, and TAFs. But I don't have a good feeling about this. So instead I go to the local public forecast for Montreal:
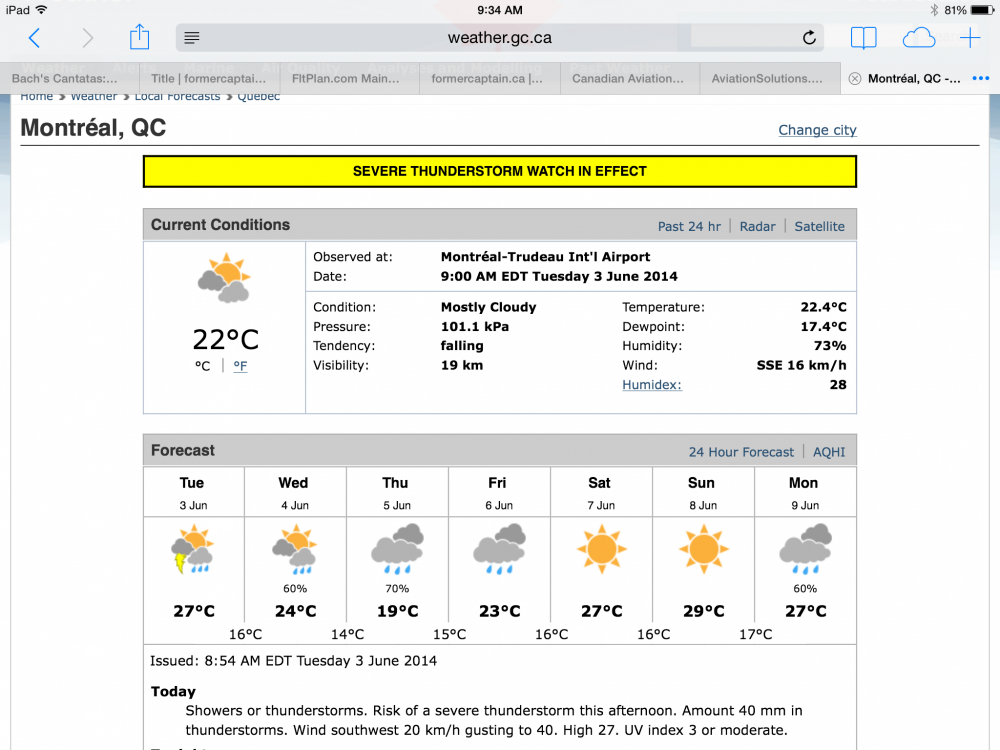
Montreal Weather
Yeah, I thought so. Severe Thunderstorm Watch in Effect. I go to my iPad and the ForeFlight App to get the picture for right now.
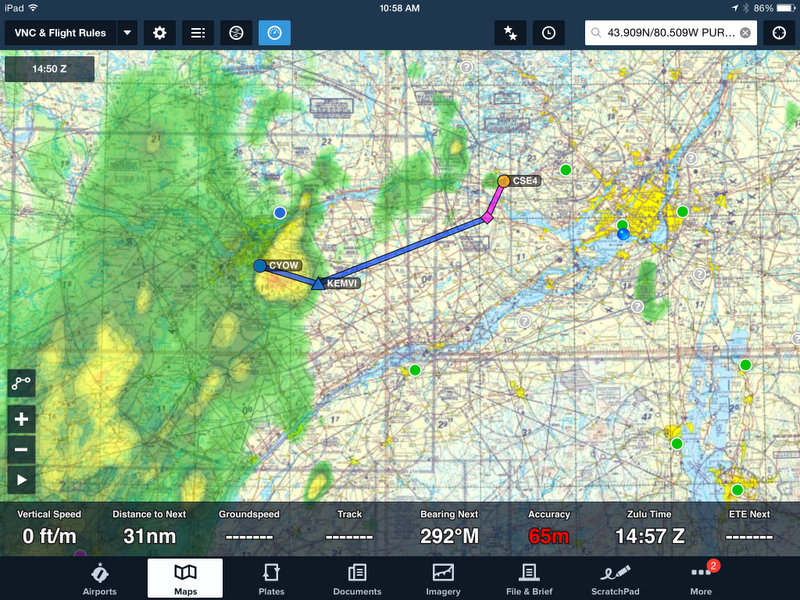
Route Weather 1450Z
You know, I could wait for the cold front and that line of thunderstorms to pass and then go. But that would put the flight back into late afternoon, and that doesn't work for me.
So it's a scrub. Leave the airplane in the hangar where it belongs in this type of weather. We'll try again tomorrow in Flight Planning 102.
P.S.
Oh, and here's the picture at 1550Z.
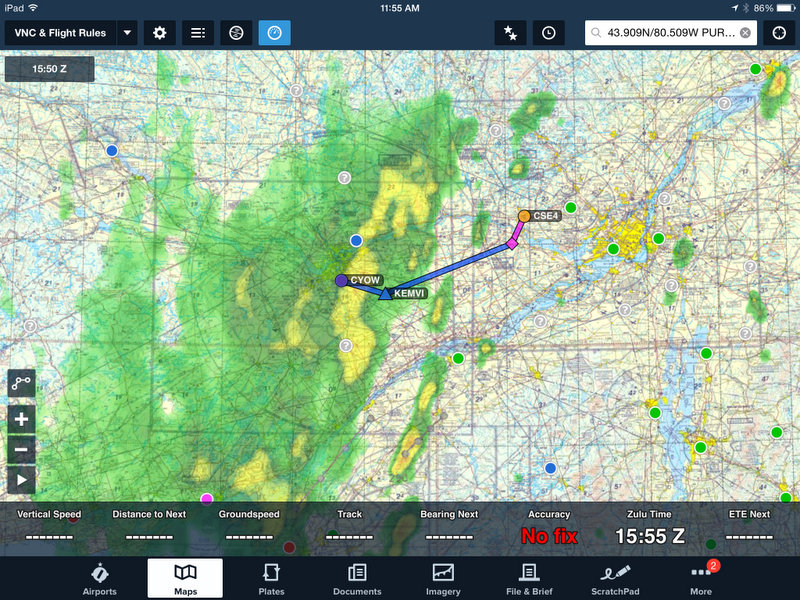
Route Weather 1550Z
P.P.S.
So I perhaps could have launched at 1830 for a 3PM arrival. Oh well. Tomorrow is another day.
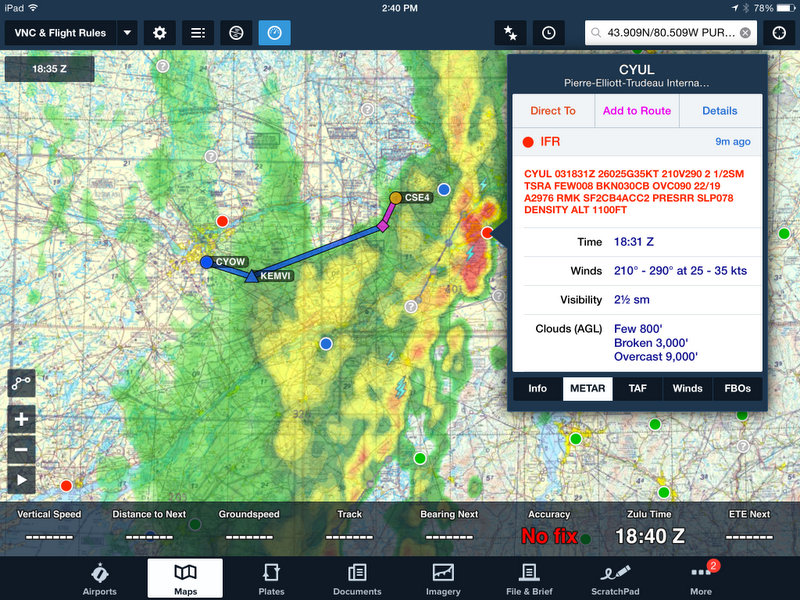
Route Weather and Montreal Dorval METAR 1835Z